
A new look beneath a busy cruising area
NOAA and the Connecticut Department of Energy and Environmental Protection have selected a new seafloor mapping project for west-central Long Island Sound through the fiscal 2027 Brennan Ocean Mapping Fund process. NOAA says the planned work will cover about 79 square nautical miles, filling a gap in seabed knowledge between areas that have been surveyed in earlier phases.
The announcement is particularly relevant to boaters because the Sound is simultaneously a cruising route, a working waterway and a complex coastal ecosystem. Better bathymetry can eventually inform nautical charts, while a closer understanding of seabed composition can assist environmental planning without requiring the same survey area to be mapped separately for each purpose.
This is a plan for future fieldwork, not a notice that the water has already been surveyed or that new depths have been published. Anyone navigating this season should continue to use current official charts, updates, notices and normal seamanship instead of treating a proposed survey boundary as verified hydrographic information.
Why Long Island Sound has difficult bottom conditions
The Sound's underwater topography reflects a long geological history, including the actions of glaciers and changes to ancient lakes. Its seabed is not a uniform layer of sand but a mixture of clay deposits, coarse gravel, rocky reefs and boulder fields whose characteristics can change over comparatively short distances.
For a skipper, the practical chart question is usually depth and obstruction information; for an ecologist, the same terrain helps determine which plants and animals can thrive. NOAA says the planned mapping will collect modern depth measurements alongside data describing the texture and type of seabed, broadening the usefulness of each survey pass.
The project's value is most obvious where older information is sparse or inconsistent with modern high-resolution survey standards. That does not mean any particular anchorage or fairway is hazardous, only that better evidence can reduce uncertainty for those maintaining charts and managing the marine environment.
Bathymetry and backscatter: two complementary views
Bathymetry measures the shape and depth of the seafloor, typically using acoustic equipment that sends sound toward the bottom and interprets returning signals. This information can reveal slopes, troughs and submerged features that may need further inspection before hydrographers decide how they affect navigation products.
Backscatter measures aspects of the strength and character of acoustic returns and can help scientists distinguish seabed materials. Interpreting it requires care: a patch that appears different in acoustic data needs further checking before anyone can confidently label it as gravel, clay, rock or another habitat type.
NOAA explains that the wider mapping initiative pairs acoustic surveying with sediment samples and digital imagery to verify what the instruments suggest. This combination helps create a stronger environmental picture than depth data alone, especially where the seabed supports fragile habitats or proposed cable routes.
The phase-by-phase project and the new gap
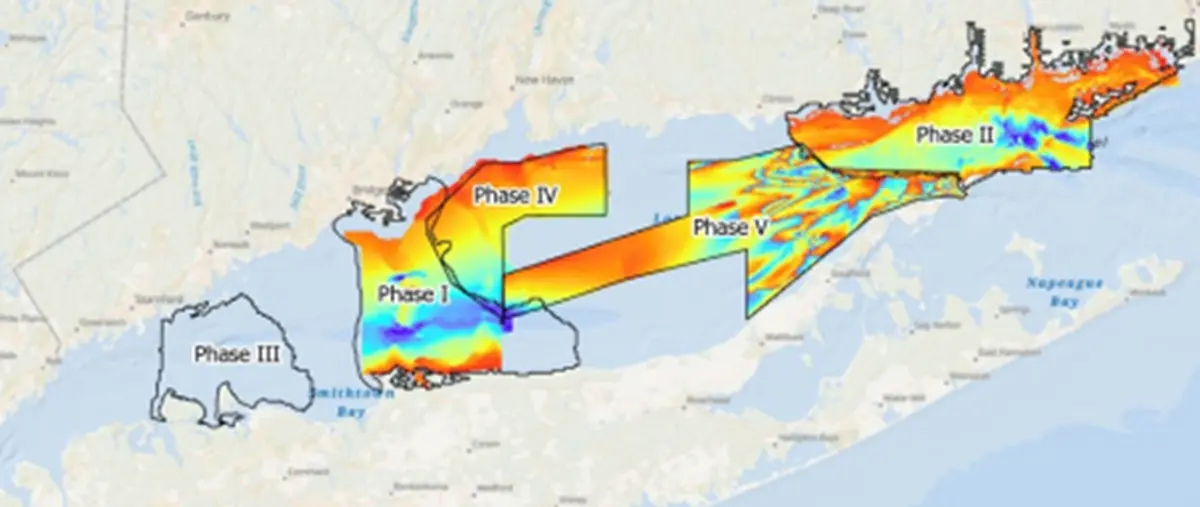
Long Island Sound has already been divided into mapping phases through a regional Seafloor Habitat Mapping Initiative, which brings together public agencies, researchers and other partners. NOAA reports that Phases I and II have been mapped and characterised, survey work is underway in Phases III and IV, and Phase V was completed through an earlier Brennan-funded project.
The FY2027 project will concentrate on the previously unsurveyed area between Phases I and III and renew relevant backscatter information. That is a more precise description than a claim that the whole Sound is being remapped, and it gives boaters a better sense of where new knowledge is expected to emerge.
The broader partnership aims for complete mapping and characterisation of Long Island Sound by 2035, according to NOAA's October account. That longer horizon reflects the scale of the task and the need for consistent methods over many field seasons; it should not be mistaken for a completion promise attached to this one 2027 contract.
From seafloor habitats to future chart corrections
NOAA describes several principal bottom habitats, with organisms such as mussels and sponges helping build the structures on which other species depend. Changes in their distribution are among the reasons scientists want fresh measurements, while underwater cables and other potential infrastructure provide another reason to know the terrain accurately.
Environmental managers can use combined geological and biological evidence when assessing the possible effects of construction or altered ocean conditions. The same seabed data can support Coast Survey's navigation work by identifying features requiring attention and informing subsequent updates to charted depths and hazards.
Survey data do not appear automatically on a boater's plotter the moment a vessel finishes a transect. They have to be processed, checked and incorporated into the appropriate chart and data services, with timing determined by the relevant agencies and the significance of what the survey discovers.
NOAA says the information will feed into a joint Connecticut–New York assessment of ecological and use sensitivities across the Sound. That means identifying where activities and vulnerable environments overlap, an important distinction from simply counting which species are present in an isolated survey square. Such analyses can inform policy, but a completed seabed map is not by itself a new rule for anchoring, fishing or boating.
The programme also shows why collaboration matters in hydrography: a single set of well-documented measurements can serve navigation, habitat science and infrastructure planning. When agencies agree in advance on coverage and data quality, they can avoid needless duplication and give future users better information about the uncertainties and limits of each mapped area.
What recreational boaters can do now
While NOAA and Connecticut prepare the planned work, recreational crews can make sure their chartplotter's electronic chart coverage is current and understand how their provider distributes corrections. For US waters, NOAA's electronic navigational charts and navigation update services are appropriate official starting points, alongside applicable Coast Guard notices and local harbour information.
Do not treat the published project-area map as a navigation chart. It is a planning graphic showing mapping phases, not a source for calculating safe depths, clearing underwater obstructions or deciding where to anchor an individual boat.
For anyone interested in coastal conservation, the project is also a reminder that an invisible seabed underlies much of the experience of a cruising ground. The eventual data may help planners understand habitats as well as routes, but the near-term responsibility for safe passage remains with the skipper using presently available, fit-for-purpose information.